Globally and locally, renewable energy remains at the forefront of most environmentalists minds. Here in the United States, efforts in sustainability have rapidly developed over the past few decades with many upwards trends in renewable energy adoption.
To bring you up to speed, we will dive deep into the past and present of renewable energy in the United States. Using real data from recognized national sources, this article is designed to help paint a picture of renewable energy in the United States in order to best predict what can be expected in the future.
Let’s start by defining renewable energy. According to the Natural Resources Defense Council, renewable energy can be defined as any kind of power that “comes from natural sources or processes that are constantly replenished.“
Essentially, in order to be classified as “renewable” the energy’s source has to be continuously available such as the wind or the tides. In some instances, the fuel source may be only available intermittently (i.e. solar power can only be harnessed during the day), however a renewable energy source is never reliant on a power source that has a limited supply.
Renewable energy encompasses the technology behind many different power sources all around the world. Because of this, the term is often synonymous with a few other classifications. Most commonly, renewable energy may also be called clean energy, green energy, undepletable energy, sustainable energy, or simply “renewables.”
Across the United States, different areas of the country have been adopting a myriad of renewable energy sources that are best suited for their region. New York State, for instance, have unveiled a plan to produce 50% of its electricity from renewable sources by 2030. Most commonly, here are the different power sources that can be considered renewable:
Of course, some will argue that the equipment and technology required to harness some of these energies cannot be considered “renewable,” as they are constructed from earthly and synthetic materials of which there is a limited supply.
What is important to understand here is that the energy itself is considered unlimited, rather than what is used to capture it. Furthermore, nuclear energy cannot be considered renewable energy, as it requires the extraction of Uranium, which has a limited supply.
It is undeniable that the production and use of renewable energy has seen substantial growth in the United States over the past ten years. At personal, business, and organizational levels, people and entities are switching to renewable energy for a number of different reasons. Most commonly, these include:
With all of the benefits that renewables provide, one may assume that people are doing everything in their power to adopt new sources of energy. Whereas this may be true in some instances, unfortunately there are still a large number of limitations and red tape that prevent renewable energies from being rapidly adopted in the United States. These include:
Over the past 10 years, renewable energy has seen consistent year over year growth in terms of production and consumption nationwide. This trend can be attributed to the growth in both the number of large utility scale and small scale renewable energy systems.
To start, let’s take a look at what’s being done on a large scale. Below, here is a chart that shows the total amount of renewable energy that was generated by utility scale facilities over the past 10 years.
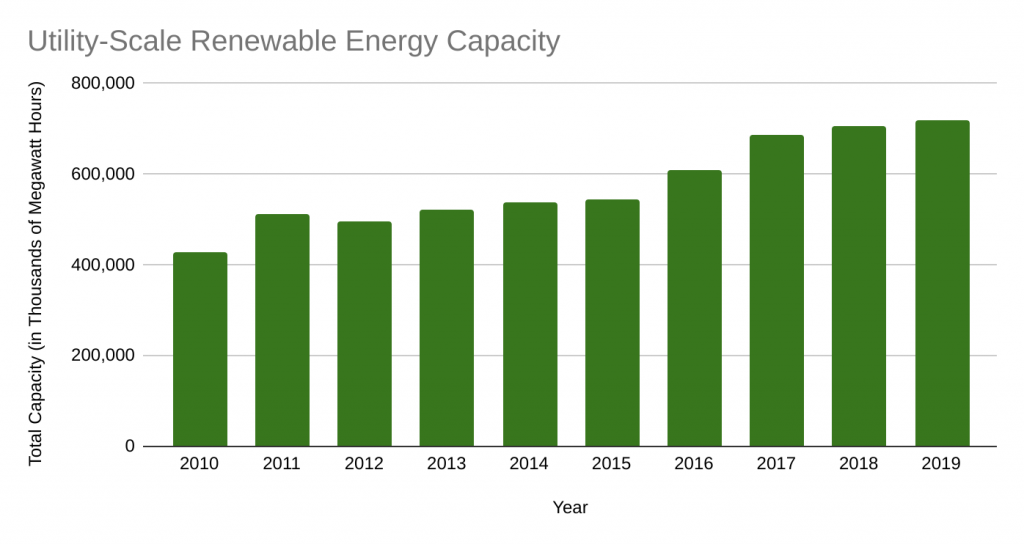
From the data, it is easy to see that large-scale renewable energy systems continue to generate more and more power with each passing year. Aside from a small dip in 2012, every year saw an increased amount of energy produced from renewables, with large jumps being made in 2011, 2016 and 2017.
Although they do make up the overwhelming majority of installed capacity, large-scale renewable energy systems are not the only player in this game. In 2014, the United States Energy Information Administration (EIA) began tracking the estimated production of small-scale photovoltaic solar systems. Below, here is a chart showing the growing amount of electricity produced by rooftop PV solar systems.
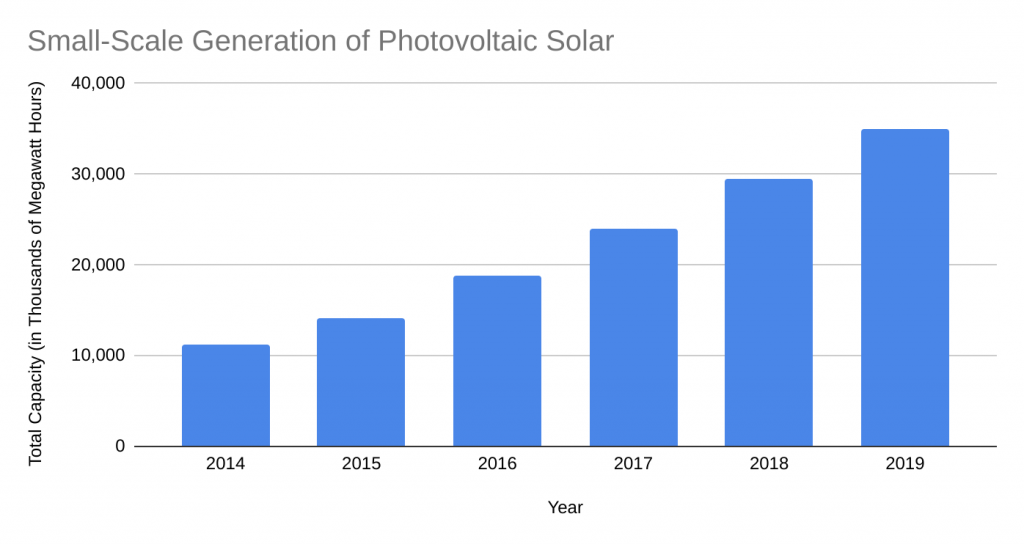
Clearly, home and business sized PV systems are trending up, as thousands of Megawatt hours are being added each year. Although this only contributes a small percentage to the national energy generation, this data is still extremely impressive. In 2019, PV systems on homes and businesses generated almost as renewable energy as utility-scale systems (including those from other sources) did 9 years prior.
Whereas many small scale renewable energy systems are not currently being monitored, many PV installations are tied to the grid and therefore it is easier to monitor their performance. Currently, there is no surveying or aggregated data for small-scale off-grid renewable energy systems.
So clearly, solar is growing at a rapid rate. However, harnessing energy from the sun is not the only source of energy that is trending up. In fact, wind energy is the fastest growing renewable power source in the past 10 years. In the chart below, you can see the energy production trends among the highest capacity sources in the United States.
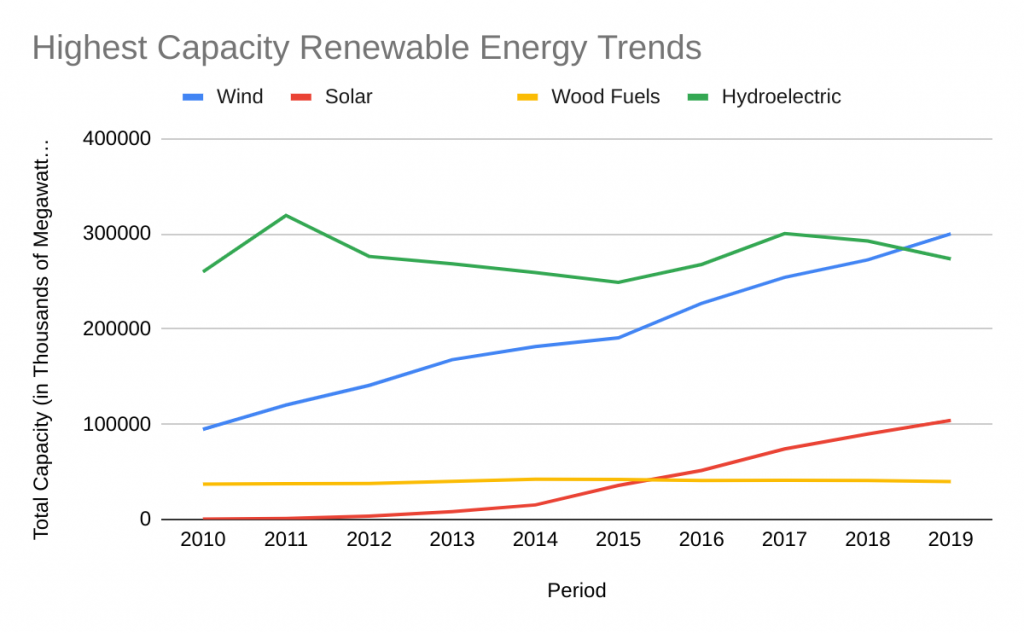
Clearly, hydroelectricity is the most tried-and-true sustainable energy source in the United States. Although technically trending down, hydroelectricity remains at the forefront of US renewable energy production. Beyond this, solar and wind energy are seeing tremendous growth, with year over year increases in renewable energy produced.
Overall, a growing shift in renewable energy production is the key takeaway from the United States energy data over the past ten years. Significant increases in large scale and small scale solar applications lead the way alongside rapidly growing utility-scale wind energy production.
In 2020, renewable energy is at an all-time high in the United States with trends indicating that its year over year growth will continue on into the future. In fact, in May of 2020, renewable energy consumption surpassed coal for the first time in the United States in 130 years. To understand this further, let’s break down renewable energy use in the United States by both region and fuel source.
First, let’s take a look at some of the states that are producing almost exclusively renewable energy. In the graph below, you can see the percentage of energy production from renewable resources that each state produces.
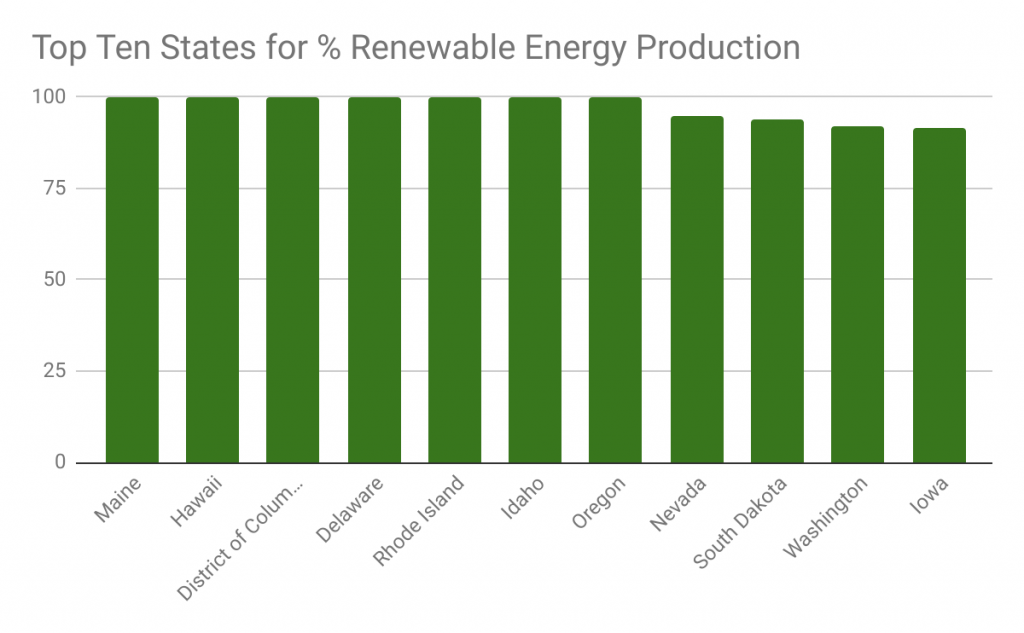
In the fall of 2020, five American states (and the District of Columbia) are able to claim that 100% of its energy is created from renewable resources. In addition to Washington DC, the five green shining stars are Maine, Idaho, Delaware, Hawaii, and Rhode Island. With that being said, the state of Oregon is sure to join this list soon, and deserves an honorable mention with 99.8% of its energy currently being produced from renewable energy resources.
All inclusively, here are the rankings for the top 10 states in terms of percentage renewable energy production in the autumn of 2020:
1. (tie) Idaho, Maine, Delaware, Hawaii, and Rhode Island (100%)
6. Oregon (99.8%)
7. Nevada (94.71%)
8. South Dakota (93.87%)
9. Washington (92.25%)
10. Iowa (91.69%)
After the top ten, Minnesota is the next highest ranking state, which takes a large percentage drop producing roughly 66% of its energy from renewable sources. At the bottom of the list, many coal, gas and oil producing states such as Wyoming, Alaska, West Virginia, New Mexico, Louisiana, Utah, Kentucky and Texas only produce 3% of their energy from renewable resources.
Now naturally, most people are not interested in the percentage of renewable energy production, but rather the actual output of the state’s systems. In the chart below, you can see the top ten states in terms of estimated renewable energy production during June of 2020.
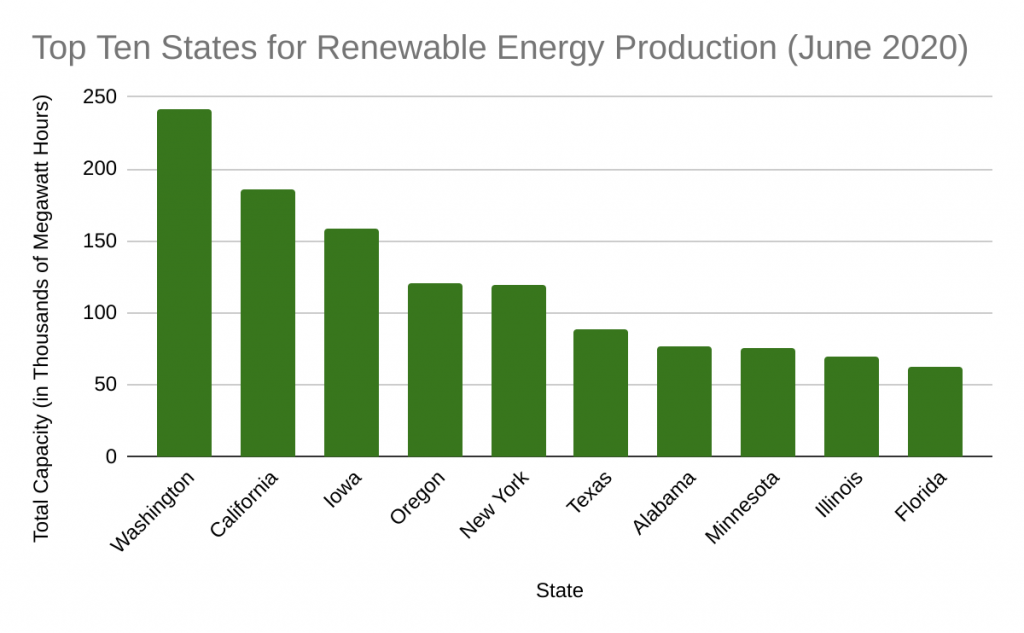
Here, Washington leads the way with nearly 250,000 Megawatt Hours of renewable energy production in June of 2020. This is attributed to about 80% hydroelectric power. In total, Washington makes up just over 10% of the United States current renewable energy production.
Beyond this, California is an unsurprising second with Iowa, Oregon and New York also producing over 100,000 Megawatt hours of renewable energy. Hydroelectricity and biomass are the top contributing factors to these top five states.
Each month, the United States Energy Information Administration (EIA) releases more information and data about the current state of federal energy. In June of 2020, there was an estimated total of 73,980 Thousand Megawatt Hours of renewable energy generated in large-scale and small-scale systems. Below, here is a breakdown of that figure by each power source.
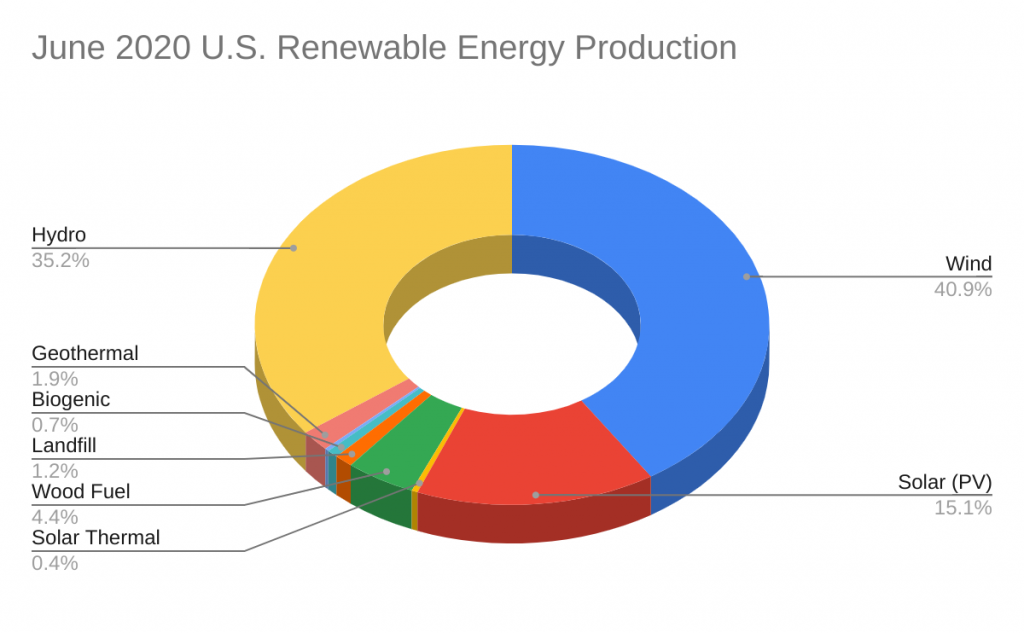
Somewhat obviously, the key takeaway from this data is that wind is king when it comes to renewable energy in the United States. Although its percentage is somewhat alarming, this should come at no surprise as wind farms can be seen in nearly all 50 states. Wind energy can often be seen on most trips along interstate highways, as wind turbines in the distance are often accompanied by enormous blades being transported on truck beds across the country.
Following wind energy, hydroelectricity is a close second, with solar PV slowly gaining its percentage share. In the graph above, one small sliver of the pie chart is unlabeled. The light blue section is for waste biomass which makes up a very small fraction of the national energy totals.
Although it may almost sound redundant at this point, the main takeaway from this article is that renewable energy is growing in the United States. Upward trends in the production and consumption of sustainable resources at both the small and large scale levels provide evidence of a greener future.
First and foremost, utility-scale wind energy can be expected to retain its momentum and continue to scale upwards. Although it is not as easily adopted in the private sector, wind energy can be produced sustainably around the clock at scale. As existing turbines continue to operate while new capacity is added, electricity produced via wind energy in the United States has no signs of decreasing anytime soon.
For both homes and businesses, small-scale photovoltaic solar energy systems continue to gain momentum in rapid adoption nationwide. Although the federal Investment Tax Credit is beginning to decrease in value,this is not expected to halt the growing trend in rooftop solar as it becomes more affordable and mainstream.
On top of this, 2020 is the first year in which new buildings are required to install solar energy systems in California. With the California Solar Mandate, PV capacity is sure to increase within the state as well as within states that the legislation inspires.
Unfortunately, there are many barriers to entry with rooftop solar. Systems must be purchased by the property owner and performance is largely varied by region and the individual property. Thankfully, community solar programs and other green energy organizations make it possible to still adopt renewable energy.
For people who do not own homes (or simply do not have the ideal setup for solar energy), community solar projects offer a chance for consumers to purchase renewable energy as the primary source for their electricity. In the United States, community solar is predicted to continue to grow in popularity with the addition of an estimated 3.5 GW of capacity expected in the next five years.
The growth of community solar is reflective of its ease of adoption. Not only is it easy for non-property owners to purchase, but large solar garden projects are also popular in places that have otherwise no solar development. Beyond its simplicity, community solar is also helping many homes and businesses save money.
With the growth of any industry, it likely comes with more jobs. This is not untrue for renewable energy. In fact, in 2019, there were an estimated 3.3 million clean energy jobs across the country. In addition to jobs working directly to develop systems and harness energy, there is also a growing number of jobs in related technologies such as clean energy vehicles.
This upward employment trend is not limited to any specific region, as industry growth has led to more sustainability jobs in every US state. In 2019, the top five states for renewable energy employment were California, Texas, Florida, New York and Michigan.
Across the board, one of the leading factors that has contributed to the growth of renewable energy adoption has been the lower overall cost of doing so. In the past 10 years the cost of parts and labor for small scale solar and wind systems have dramatically dropped and are expected to continue to do so.
In fact, the National Renewable Energy Laboratory (NREL) has predicted that the cost of wind energy will drop by 50% by the year 2030. The organization has also discovered that building new solar and wind power plants are likely to incur less overall costs than continuing to operate existing coal power plants. With this in mind, renewable energy capacity will continue to grow as both small and large scale costs are lowered.
Following California’s lead, many states and cities across the country are beginning to adopt renewable energy policies and goals. In fact, 127 cities in the United States have committed to goals of 100% renewable energy, some of which have already reached that pillar.
Beyond the municipal level, private companies are also expected to continue to adopt new energy goals. Large organizations such as IKEA and Google have recognized the importance of their carbon footprint while being able to lower operating costs with small scale renewable energy systems.
Ultimately, the United States is currently in the midst of a renewable energy revolution. With many states producing a large amount of hydroelectric power, growing trends in national wind and solar energy paint the picture of a greener tomorrow.
Sources:
© PowerSetter.com. All rights reserved.
![]() Green energy choices available
Green energy choices available